Reverb: Memory Management
Reverb is
a pre-filtered reverb. This sample illustrates the problem associated when using a “lot” of
memory, here with the reverb delay lines.

Overview
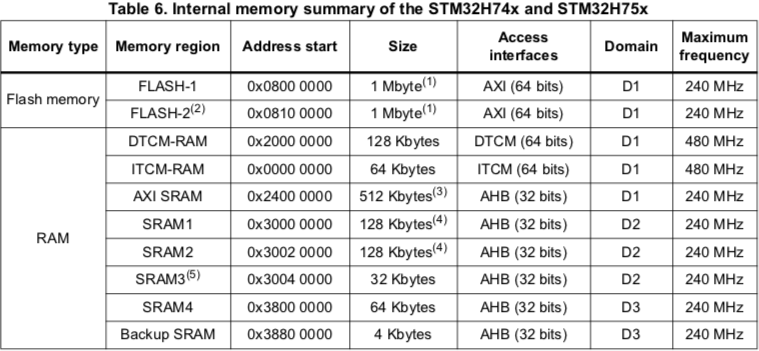
On embedded platforms, like Daisy, the natively available memory is very limited compared to what desktop or mobile software developers are used to. For example, with the STM32H7 and on the Daisy Seed, the stack is only 128KB and the memory allocator is using a memory called “AXI SRAM”, and this memory is only 512KB.
However, this is not all the memory available to your application. The Daisy Seed has for example a SDRAM chip connected to the main processor, and this SDRAM chip can handle up to 64MB of memory.
Unlike desktop computers, The Daisy Seed processor, like most embedded processors, doesn’t have a memory management unit (MMU), and the 32-bit addresses available to your application map directly to the hardware, like the Linux kernel would see them.
Unlike desktop applications, you don’t need to allocate memory, you just claim a range of addresses, and in fact this is your entire responsibility!
Should you use the SRAM or SDRAM, the address space is quite small. And because you don’t have a MMU, memory allocations suffer from the same plague that was hitting old OSes running on processors with no MMU like the very old Apple Macintosh: memory fragmentation.
To avoid that, and when possible, allocations are done once and for all using the maximum possible memory your application could use. Internally, your program uses just a portion of it.
For the rest of this tutorial, if you want to follow along, we will consider that you have setup your environment properly as described in ../getting-started/setup.
How does it work?
This is the time to open the engine powering the Daisy platform,
called libDaisy. Eurorack-blocks uses it
to access the hardware for all sort of operations. What you have in this chapter is
probably the only thing you need to know about embedded software engineering
when using Eurorack-blocks. Let’s dive into it.
When the build process needs to assemble all the different compilation units objects and consolidate them into one binary, it uses a “linker”. When building for the Daisy platform, we pass in what is called a “linker script”.
There are multiple linker scripts for Daisy, depending on some usage, that we will see later.
For now let’s focus on the one made to store your program in the ARM internal flash
memory, called STM32H750IB_flash.lds.
MEMORY
{
   FLASH (RX)    : ORIGIN = 0x08000000, LENGTH = 128K
   DTCMRAM (RWX) : ORIGIN = 0x20000000, LENGTH = 128K
   SRAM (RWX)    : ORIGIN = 0x24000000, LENGTH = 512K
   RAM_D2 (RWX)  : ORIGIN = 0x30000000, LENGTH = 288K
   RAM_D3 (RWX)  : ORIGIN = 0x38000000, LENGTH = 64K
   ITCMRAM (RWX) : ORIGIN = 0x00000000, LENGTH = 64K
   SDRAM (RWX)   : ORIGIN = 0xc0000000, LENGTH = 64M
   QSPIFLASH (RX): ORIGIN = 0x90000000, LENGTH = 8M
}
The address space is divided into multiple sections, which have a base address, or origin, and length. The highlighted lines are sections of memory that you use:
The
FLASHmemory is where your program is stored, this is the file you upload to the Daisy using a USB cable,The
DTCMRAMis where your stack lives,The
SRAM(also known asAXI SRAM) is where a call tooperator newormallocwould allocate to,The
SDRAMis an extra chip next to the ARM chip on the Daisy hardware, that gives an additionnal 64MB of memory.
For some modules, you can get to the point where storing samples and delay lines wouldn’t
fit on a combination of the DTCMRAM and SRAM and you need to use the SDRAM.
Now maybe a question comes in mind. Why does malloc just doesn’t care of it, and
allocate into the SDRAM when we are done with the internal SRAM?
Well, that could be done automatically, but there is at least one reason where you wouldn’t want this automatic behavior: performance.
Just considering the internal memory, that is your stack and heap space, there are
already speed differences. In fact, the DTCMRAM is running at the full processor speed,
but the AXI SRAM is only running at half the processor speed! This is a page screenshot
from the SMT32 system and architecture performance manual:
Now accessing the external SDRAM chip is even worse. Performance can be 10 times slower
than the internal DTCMRAM, but that depends also a lot on how you fetch data from this chip.
In the end, you typically want your filters memories on the stack. Then the idea is mostly to put memory buffers in SRAM and SDRAM depending on how big they are, and how many times they are accessed per audio rendering.
In C++, only you can know about this. In Max, the SRAM is the first choice to fit an object unless there is not enough space for it, so it goes to SDRAM. In Faust, the transpiler as some idea on how the memory is used and make some optimisations.
But for now, let’s continue with C++.
Preparing
First let’s configure the IDE project to inspect the project in the comfort of our IDE if you
are using one. Navigate to eurorack-blocks/samples/reverb and run:
eurorack-blocks$ cd samples/reverb
eurorack-blocks/samples/reverb$ erbb configure
If you are using Xcode, you can navigate to the artifacts folder and open the
project_vcvrack.xcodeproj Xcode project.
If you are using VSCode, just open the reverb folder in VSCode.
From Xcode, you can build using ⌘B. You can also build the VCV Rack module from the command line with:
$ erbb build simulator
Now you can open VCV Rack, and add the Reverb module and play a bit with it.
Smart Pointers
How are the reverb delay lines allocated in Reverb? Well for this, we need to look
into the dsp Library, and open the ReverbSc.h file:
const float    _sample_freq;
erb::SdramPtr <DelayLines>
               _delay_lines_sptr;
DelayStates    _delay_states = {};
erb::SdramPtr is some sort of (relatively) smart pointer which purpose is to allocate in
the SDRAM memory section. Think of it like a std::unique_ptr, it is a smart pointer that
owns and manages another object through a pointer.
But there is one catch though: when the smart pointer goes out of scope, it doesn’t dispose of this object and doesn’t reclaim the memory. Why so? Because of the memory fragmentation problem we’ve talked about earlier.
But there is just one thing you need to remember: those smart pointers are made to allocate in specific memory regions. This is a one time thing you do when you setup your dsp, and don’t do afterwards.
For AXI SRAM you would use erb::SramPtr,
and if you need to decide at compile time which region to use,
the convenient erb::RamPtr (coming soon) takes a erb::MemorySection and use
the appropriate underlying template class.
Finally yes, we also have a erb::allocate_bytes_auto, which does this dynamically,
but this is made for automatically generated DSP code, like Max, and is not adviced for C++
programming.
Now you may have a question: how do we know when running on the daisy hardware which piece of code allocated in the wrong place? It feels like you would need to plug a debugger to the Daisy hardware, which requires a dedicated hardware debugger…
This is where the simulator comes to help.
Simulator
When using the simulator with VCV Rack, we are running on the desktop and don’t suffer from those kinds of problems. But what we can do is to keep track of every allocations in every memory sections, and break into the debugger when a fault is detected, as it would happen on the hardware Daisy platform.
You can then detect the problem with your favorite IDE and/or debugger. Thanks to the callstack, you can see precisely which allocation triggered the problem.
static constexpr size_t max_time_spl
   = 4127 + size_t (max_sample_freq * 0.0017f) + 17 /* 16.5 */;
In ReverbSc.h, try to change the value of max_time_spl to a ridiculously big number like 8000000,
and then launch VCV Rack, attach your debugger, and finally add a Reverb module.
With Xcode the debugger would break as soon as you would try to drop a Reverb module instance on your Rack:

If you go back to the line 13 in the callstack highlighted on the left, you will find the culprit line!